
What actually changed conversion?
Source-linked CRO studies built from 291 normalized case-study records, a 6,700-experiment meta-analysis, and LandingBoost scan data. Each report separates the edit, the measured metric, and the limitation—so a reported click lift is never presented as guaranteed revenue.
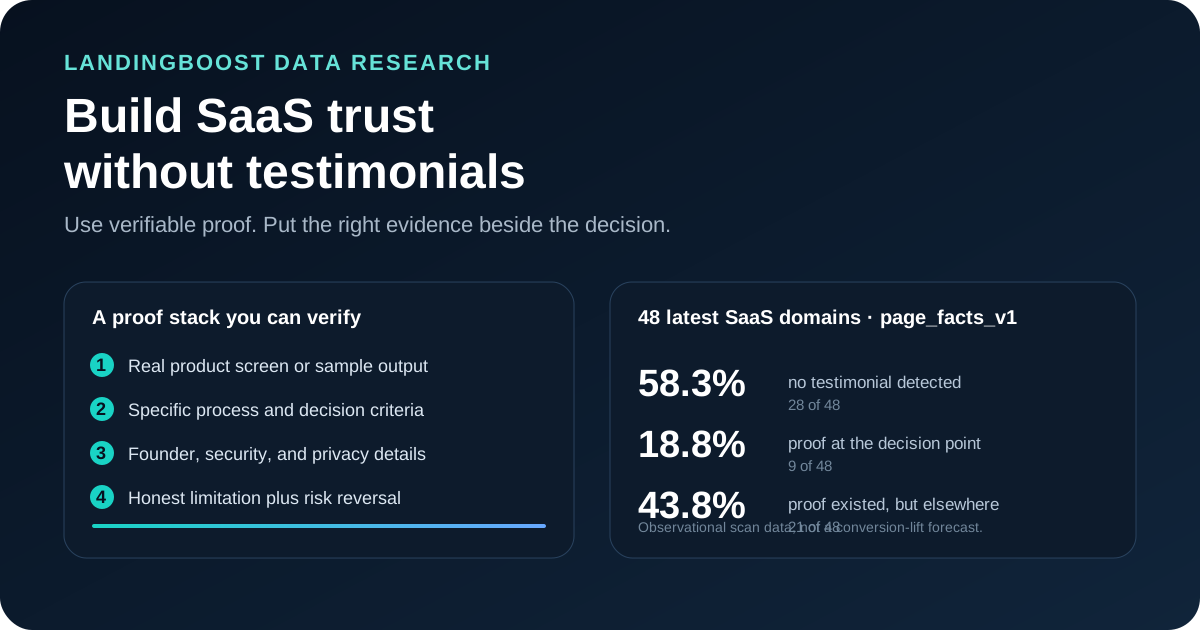
How to Build Trust on a SaaS Landing Page Without Testimonials
A 48-domain LandingBoost study shows where SaaS proof goes missing and gives founders an honest trust stack to use before testimonials exist.
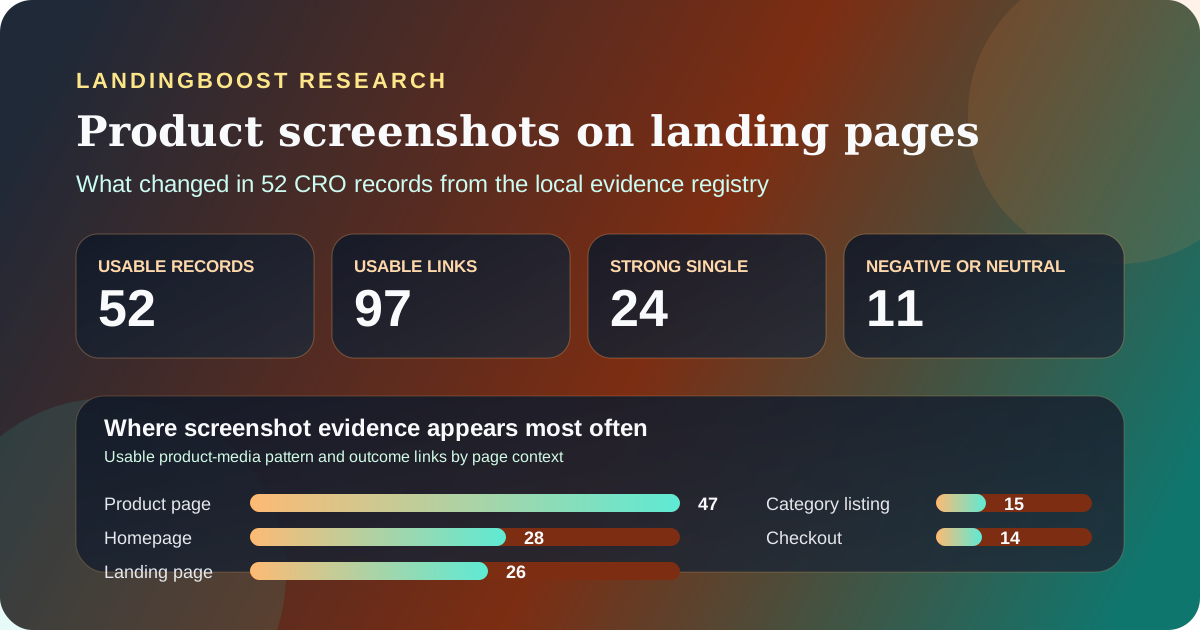
Do Product Screenshots Increase Landing Page Conversion?
LandingBoost reviewed 52 CRO records on screenshots, product images, and demo visuals to show when landing-page visuals helped and when they hurt.
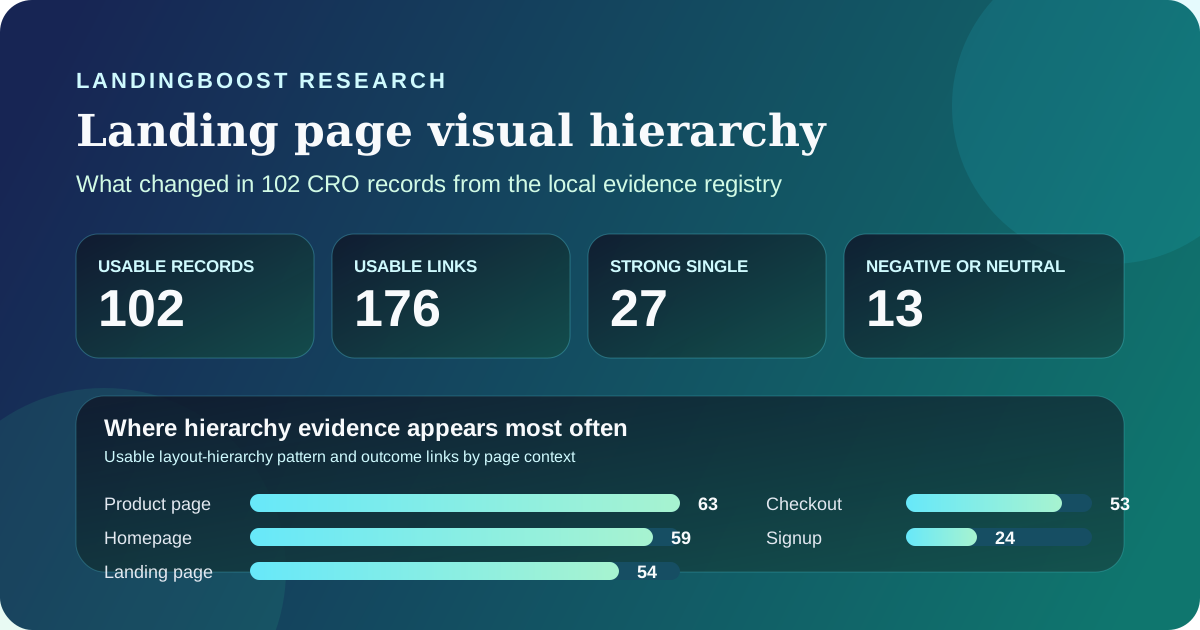
Landing Page Visual Hierarchy: What 102 Experiments Changed
LandingBoost reviewed 102 visual-hierarchy CRO records to show which landing-page layout and CTA placement changes improved clicks, signups, and sales.
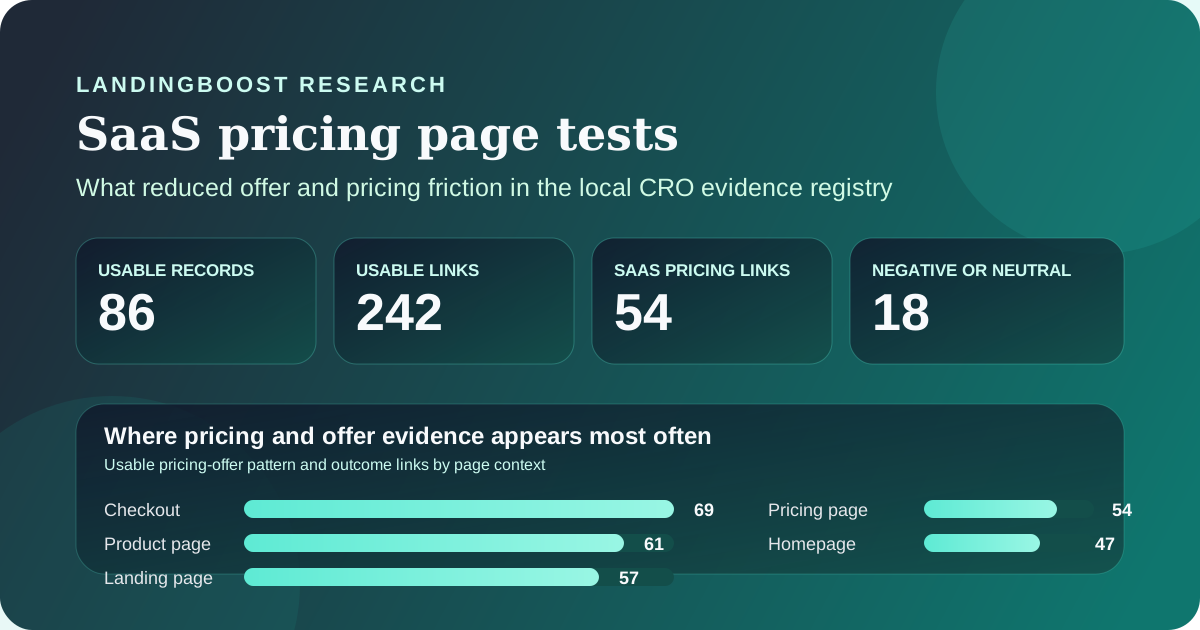
SaaS Pricing Page Tests: What Reduced Offer and Pricing Friction
LandingBoost reviewed 86 pricing-offer CRO records to show which SaaS pricing page changes improved demos, revenue, and plan selection.
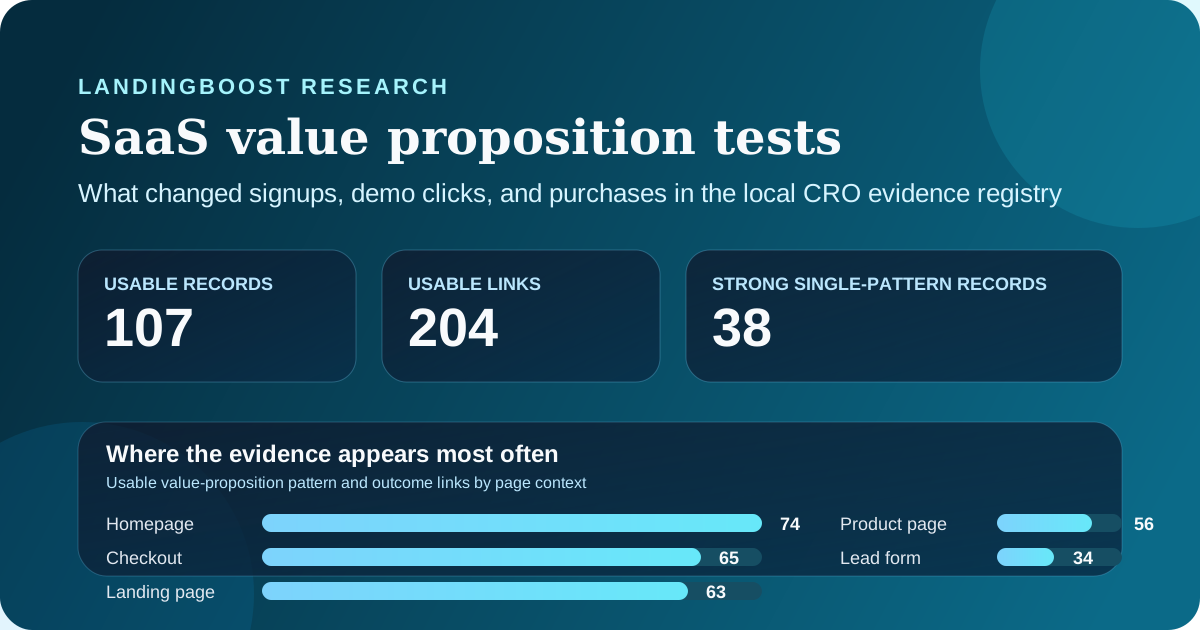
SaaS Value Proposition Examples: What Changed Signups and Purchases
LandingBoost reviewed 107 value-proposition CRO records to show which SaaS message changes improved signups, demo clicks, and purchases, plus where they failed.
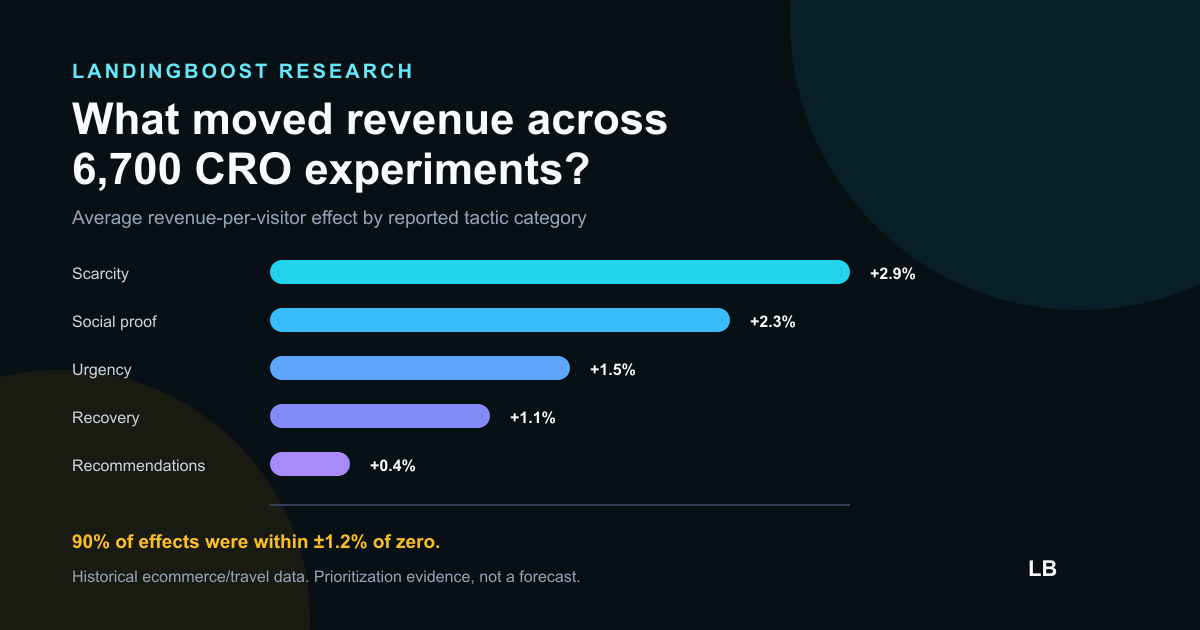
What 6,700 CRO Experiments Say Actually Moves Revenue
A meta-analysis of 6,700 ecommerce experiments found small average revenue effects, with scarcity and social proof ahead of button and CTA copy changes.
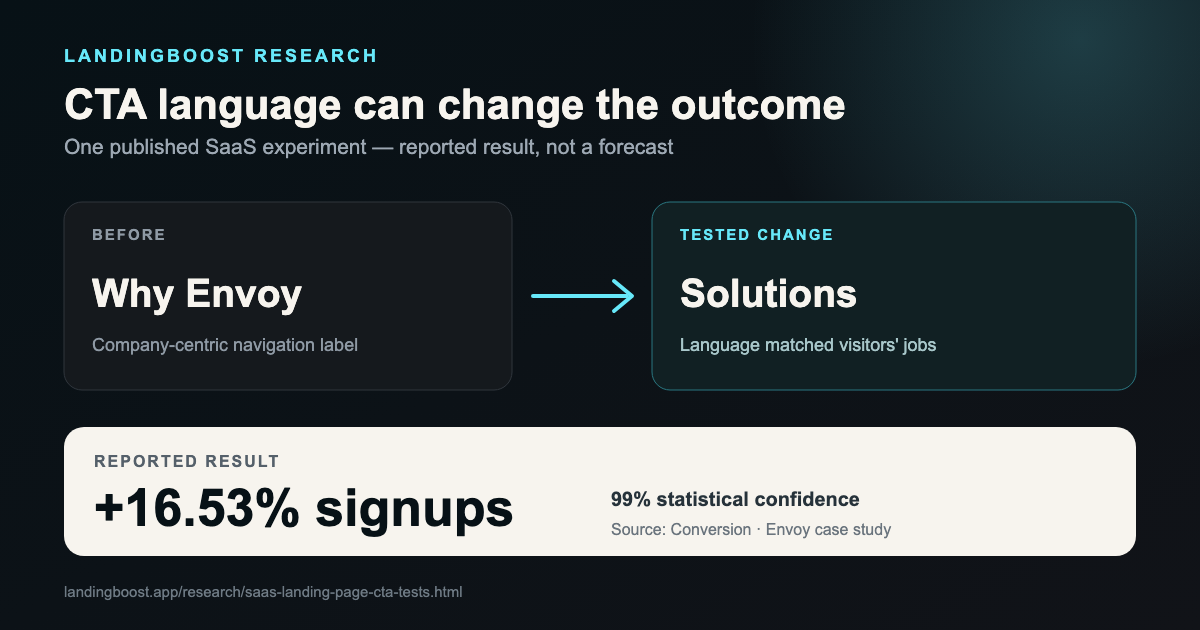
SaaS Landing Page CTA Tests: What Actually Increased Signups
Three landing page experiments show when CTA wording, navigation labels, and button choices increased signups or clicks, with metric caveats.
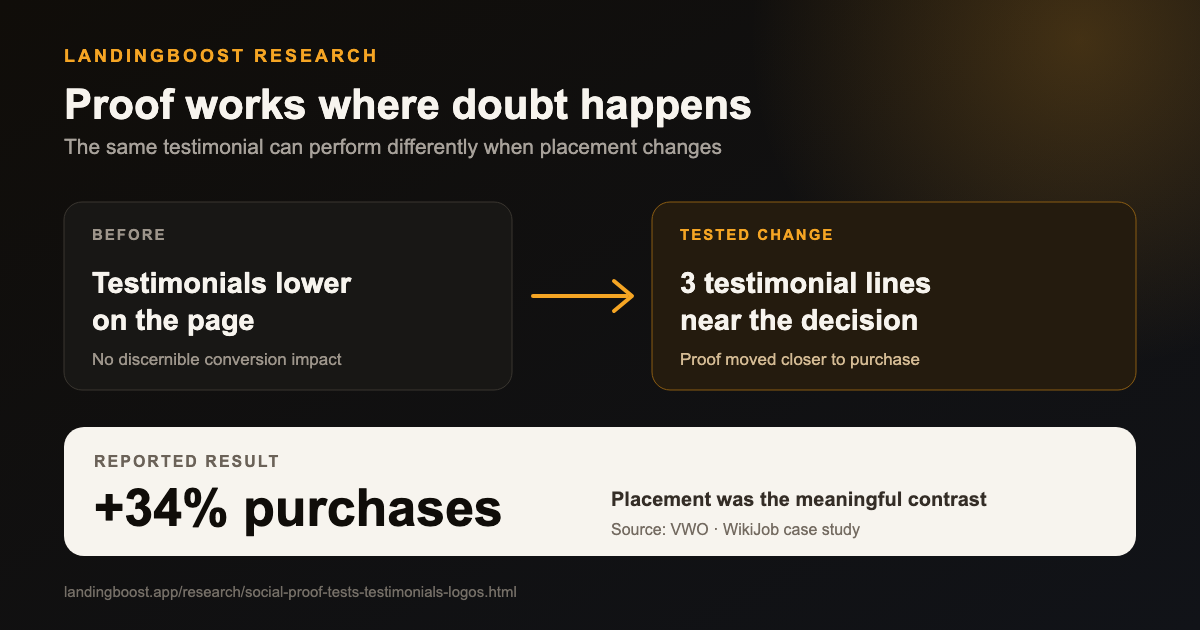
Social Proof Tests: Where Testimonials and Logos Actually Worked
Published tests of testimonials and customer logos show that proof placement and proximity to the decision can matter more than simply adding a logo row.
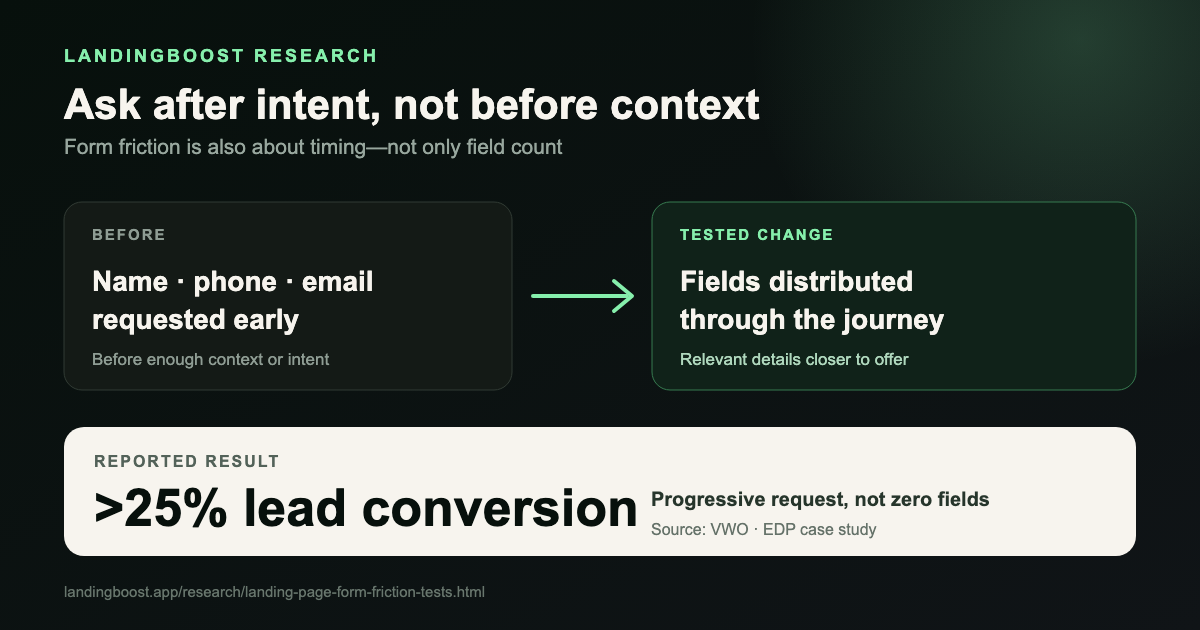
Landing Page Form Friction: What Happened When Companies Asked for Less
Evidence from published form and journey experiments shows how progressive fields, shorter processes, and clearer paths affected lead and conversion rates.
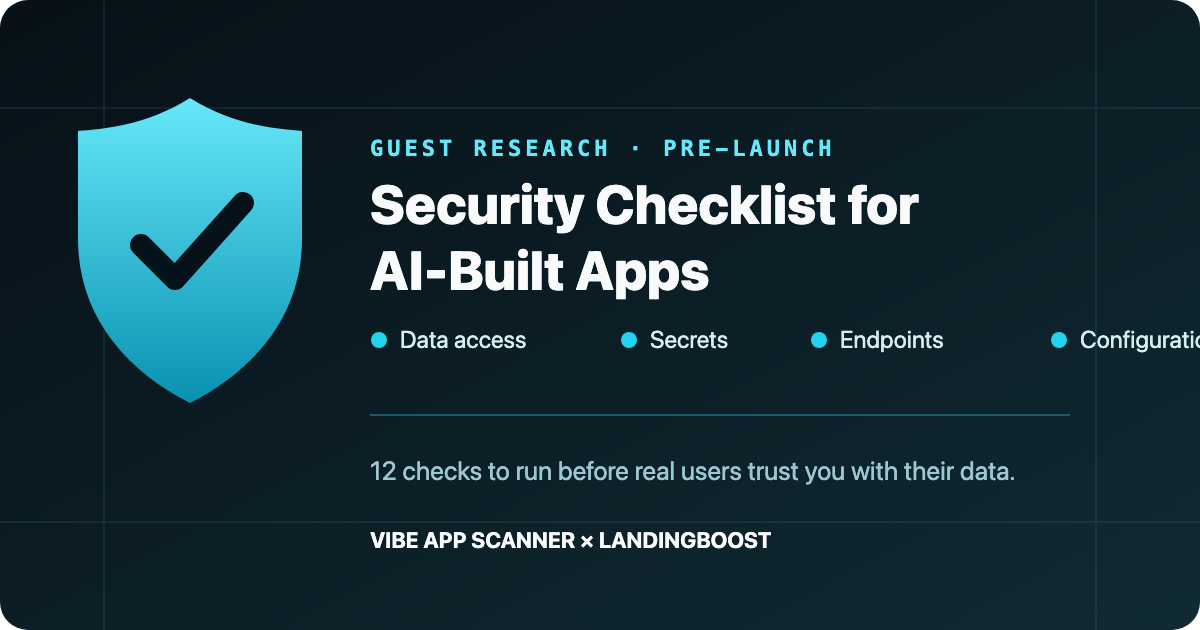
Security Checklist for AI-Built Apps: What to Fix Before You Launch
A practical security checklist for apps built with Cursor, Claude, Lovable, Bolt, and Replit, covering data access, secrets, endpoints, and deployment configuration.
How to read these reports
- We preserve the source's reported metric: clicks, signups, leads, or purchases are not interchangeable.
- We flag multi-change tests and missing context instead of assigning the whole result to one UI element.
- Use each result to form a testable hypothesis for your page—not to predict a lift.