
What 6,700 CRO Experiments Say Actually Moves Revenue
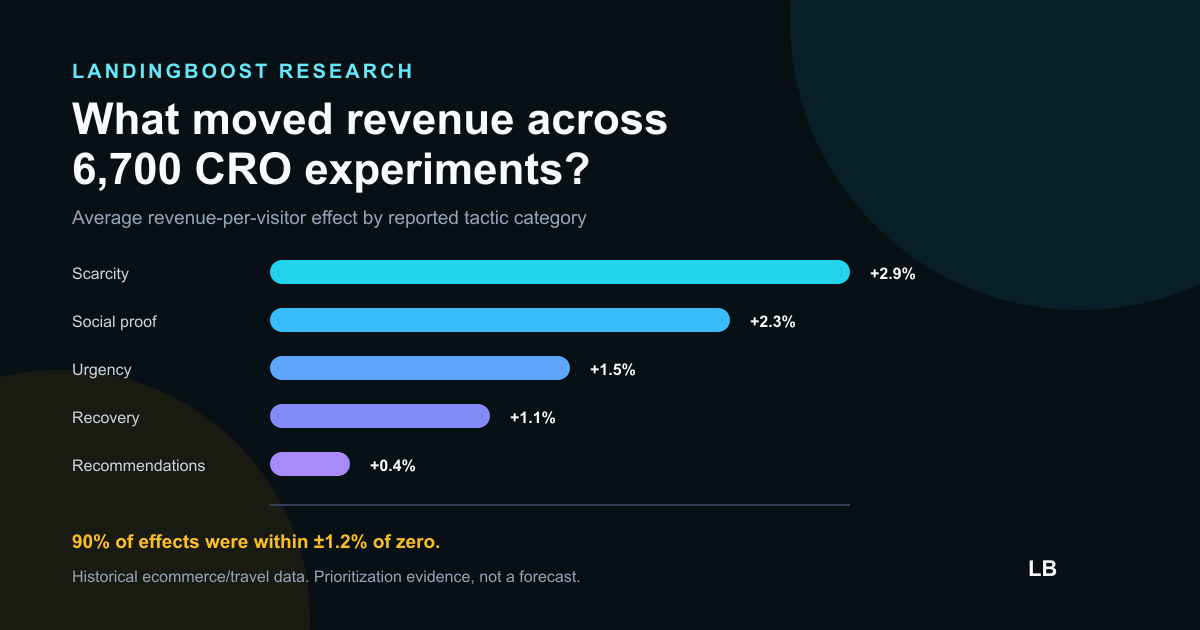
A meta-analysis of 6,700 ecommerce experiments found small average revenue effects, with scarcity and social proof ahead of button and CTA copy changes.
Key results
- Test the source of buyer uncertainty before testing visual novelty.
- Treat category averages as prioritization evidence, not a forecast for your page.
- Measure revenue, qualified leads, or activation when possible; clicks alone can overstate progress.
- Generic button or CTA-copy changes are weak defaults when the offer, proof, or risk remains unclear.
Average reported revenue effect by tactic
Category averages from the cited 6,700-experiment meta-analysis. They rank historical observations; they do not predict the result of your next test.
| Dimension | Average effect | How to interpret it |
|---|---|---|
| Scarcity | +2.9% | The largest reported category average, mainly in retail and travel contexts. |
| Social proof | +2.3% | Useful when it reduces uncertainty near a decision, not as a decorative logo strip. |
| Urgency | +1.5% | A positive category average, but only when the deadline or availability is real. |
| Abandonment recovery | +1.1% | A modest average effect from recovering visitors who already showed intent. |
| Product recommendations | +0.4% | Small on average and more relevant to catalogue discovery than SaaS pages. |
| Color change | 0.0% | No average revenue effect in the reported category summary. |
| Button change | -0.2% | A slightly negative average; a new button treatment is not a strategy by itself. |
| CTA copy change | -0.3% | A slightly negative average when isolated as a broad category. |
Why most CRO lifts are smaller than case studies imply
The most important number is not the largest bar. The source reports that 90% of measured experiment effects fell within 1.2% of zero in either direction. That is a useful correction to the dramatic uplift numbers that dominate vendor case-study libraries.
A large archive of winning examples does not reveal the probability that the same edit will work on another page. Audience, offer, traffic quality, implementation, and measurement all change the outcome. Use the category averages to decide what deserves investigation, then let your own downstream metric decide whether the edit worked.
What this means for a SaaS landing page
The source data is mainly ecommerce and travel from 2014–2017, so it should not be transplanted directly into a modern SaaS funnel. The portable lesson is about decision barriers: proof and risk reduction deserve attention before cosmetic button changes.
For a SaaS page, first confirm that a buyer understands the outcome and audience. Then inspect whether proof, security, pricing clarity, or commitment risk blocks the CTA. Only test button color or microcopy after the offer and reason to believe are already clear.
- If visitors do not understand the offer, fix clarity before urgency.
- If they understand but hesitate, move specific proof or risk reversal closer to the CTA.
- If they click but do not finish, inspect pricing, form effort, privacy, and the next-step promise.
- Track signups, qualified demos, activation, checkout, or revenue—not only button clicks.
How to use this ranking without copying it
Start with the highest-confidence bottleneck on your own page. The ranking helps break ties when several changes seem plausible; it does not replace diagnosis. A relevant proof block can be a better test than urgency even when urgency has a positive aggregate effect, because the page may have no credible deadline.
Write the hypothesis before shipping the edit: name the uncertainty, the evidence you will add or remove, and the business outcome you expect to change. That keeps the experiment falsifiable and prevents a visual redesign from being credited for every movement in the funnel.
What Works in E-commerce: A Meta-analysis of 6,700 Online Experiments
Questions founders ask
Which CRO test had the biggest average effect?
Scarcity had the largest average revenue-per-visitor effect in the reported category summary at 2.9%, followed by social proof at 2.3%. These are aggregate historical results, not expected uplifts for a specific page.
Do button color changes increase conversion?
The meta-analysis reported a 0.0% average revenue-per-visitor effect for color changes. A color change can still help when it fixes a real visibility problem, but color alone is a weak default hypothesis.
Does changing CTA copy increase revenue?
CTA-copy changes averaged slightly negative in this category summary. That does not mean CTA copy never matters; it means generic copy changes are less useful than resolving the visitor's actual uncertainty and measuring a downstream outcome.
Can SaaS companies apply these CRO results directly?
No. The dataset is mainly ecommerce and travel. SaaS teams should use the findings to prioritize hypotheses around clarity, proof, risk, and friction, then validate them against signups, qualified demos, activation, or revenue.
Method and limits
- LandingBoost uses the manually verified aggregate facts stored in its local CRO evidence registry.
- The reported effects are category averages for revenue per visitor, not expected uplifts for a specific site.
- The underlying experiment mix is mainly retail and travel ecommerce from 2014–2017.
- Publication, selection, and implementation bias still apply. This article does not estimate win probability.
Related research
Find the first testable edit on your page
LandingBoost checks clarity, CTA strength, proof, trust, and friction, then prioritizes the first conversion gap to fix.
Find my first edit free